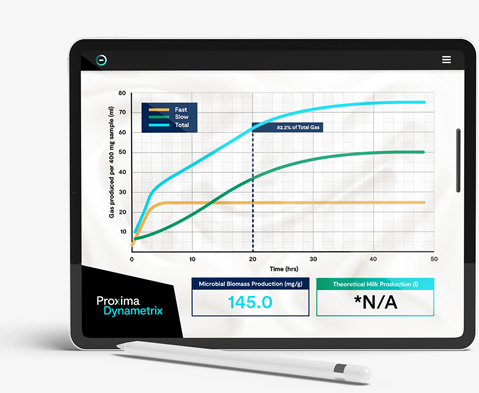
When you run Dynametrix at pen level, first look at the gas production curves on each of the scans. Do the fast, slow and total production curves look similar between scans? If not, the cows are not being offered a uniform diet. Sampling is best done at the start, middle and end of distribution. Either feeding or post-feeding samples can be taken as either can be used to demonstrate an underlying issue. Samples taken at feed can demonstrate delivery issues whereas (as soon as 30 min) post-delivery can be used to demonstrate feed sorting.