Click on the link to see an example Dynametrix report and in the section below read more about the biochemistry that powers this innovation.
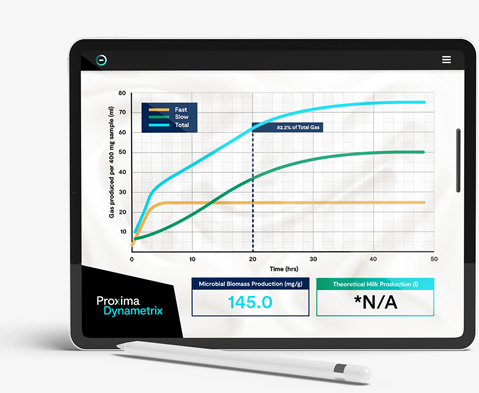
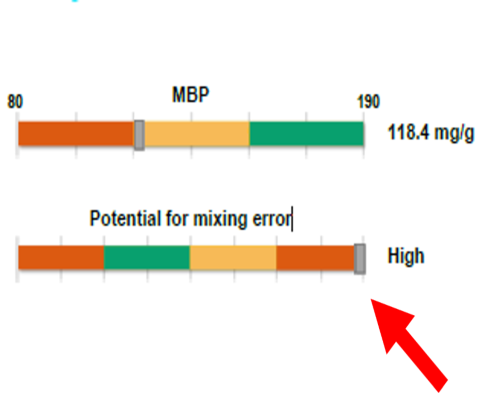
Microbial Biomass Production (MBP) is a measure of the increase in microbial biomass over 48 hours of fermentation. Higher MBP values are associated with higher milk production.
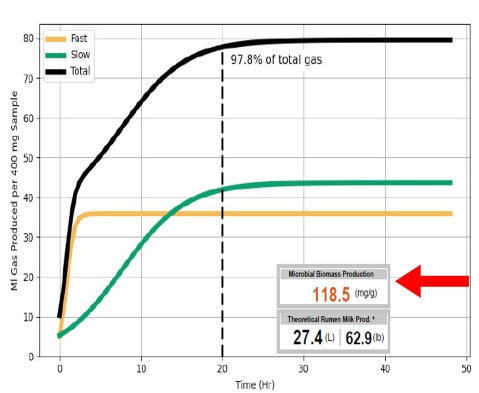
If the dry matter intake (DMI) of the diet is known, it is possible to convert MBP to estimated grams of rumen microbial protein produced
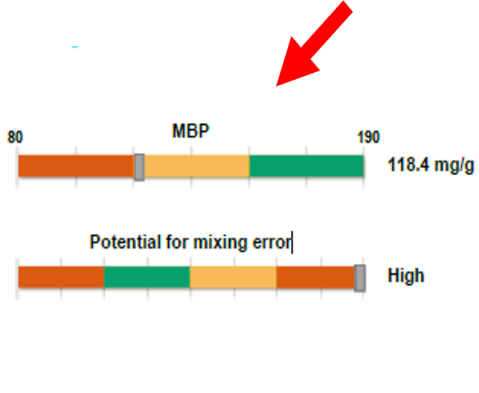
This is a simple measure to confirm that the mineral analysis of the TMR is within a typical range. If the result is at the extremes of the scale, this can indicate that mineral addition has not been implemented correctly into the mix. This parameter can also indicate how well the TMR has been mixed and distributed within the mixer wagon.
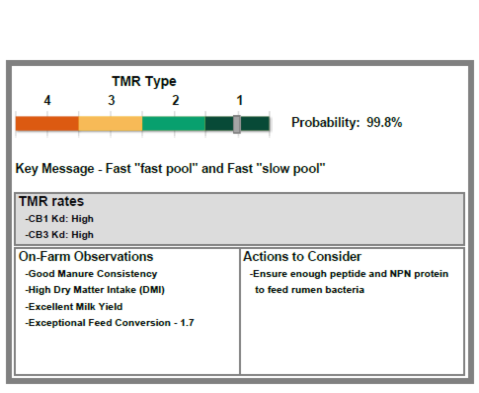
Each TMR or CS type has specific characteristics in both what we are likely to see in cow performance, and what we might consider as actions for improvement if required. To see the 4 types and their typical observations, click below:
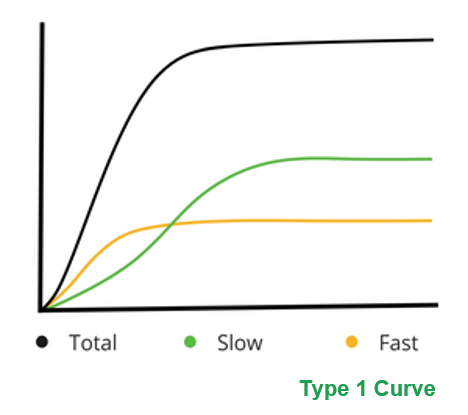
Type probabilities show the expected dominant fermentation type. This is based on the digestion rate estimation, using machine learning models (AI). It is possible for more than one probability to be reported, given that there are similarities between the different TMR types, but the AI models report the type with the highest likelihood.
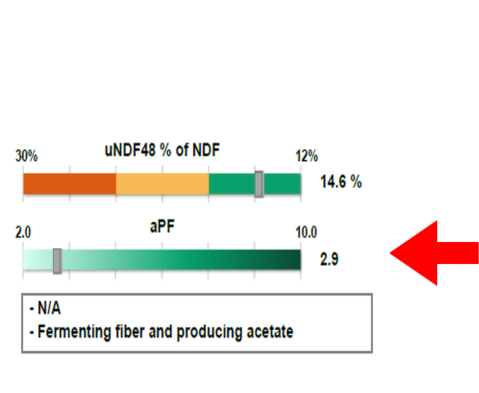
This represents the percentage of undigested NDF after 48 hours within the rumen, measured via gravimetric analysis and modelled by artificial intelligence.
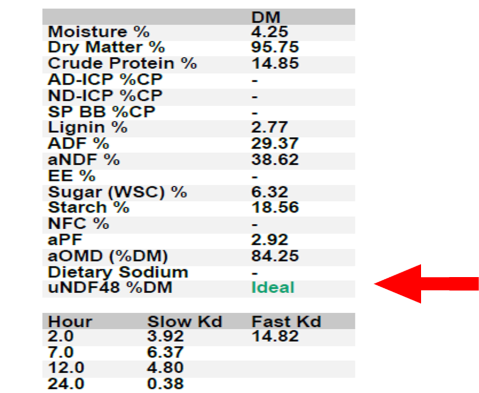
48 hours is the historic default value for rationing models.
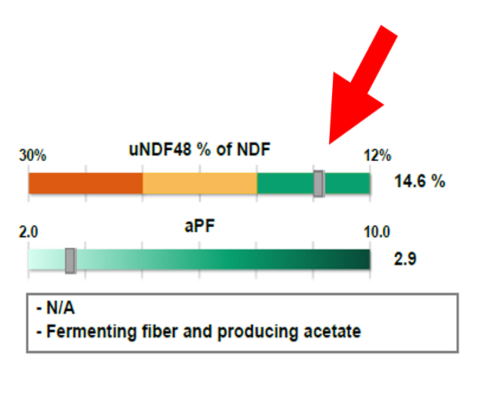
aPF is a measure of fermentation efficiency and also indicates the direction of the fermentation. aPF is calculated as:
• (short chain VFA yield + microbial protein production) / total gas production.
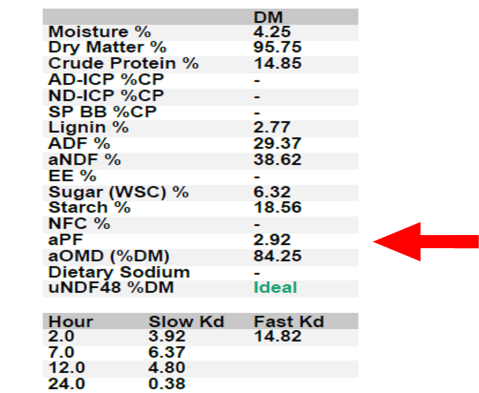
Higher aPF values indicate fermentation patterns yielding relatively greater proportions of propionate and butyrate and lesser proportions of acetate, carbon dioxide, and methane. This will yield a greater supply of ATP, which could support greater microbial growth. However, acetate is a key substrate in the formation of milk fat, requiring a balanced approach to dietary manipulation of fermentation end products.
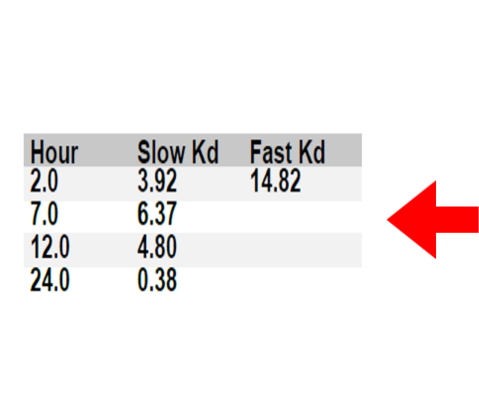
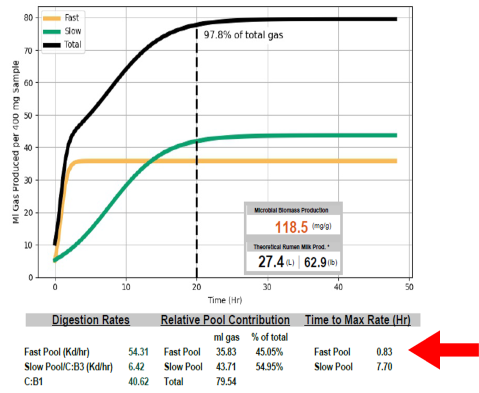
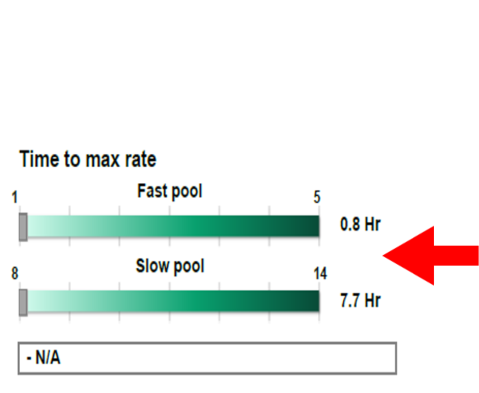
The difference between the time lags to reach maximum degradation rate for the fast and slow pools indicates digestive synchrony. Field experience suggests that when the difference between “time to max” for the fast and slow pools exceeds 10 hours, lowered milk production and/or milk components can result.
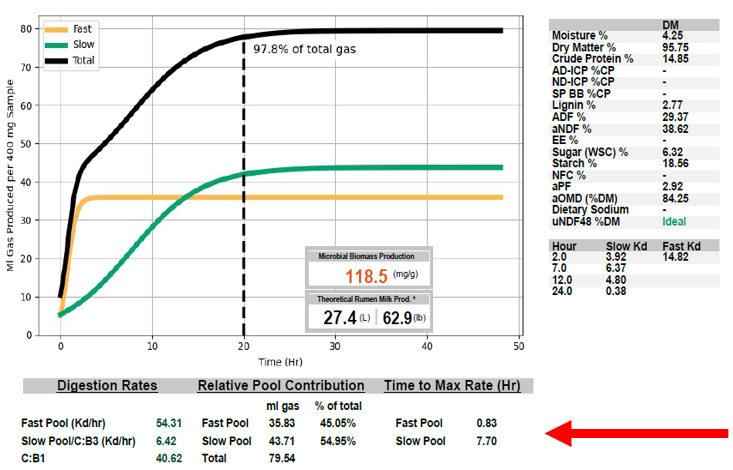
A wide difference may indicate the need for a more intermediate source of energy, such as dry corn (to slow the fast pool Kd) or more corn silage and/or higher quality alfalfa/grass (to increase the slow pool Kd).
Fast Pool Kd (%/hr)
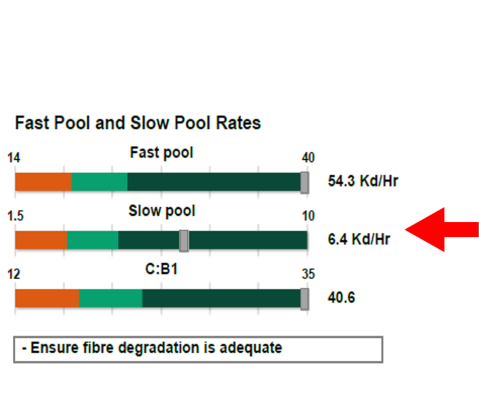
The fast pool rate (Kd) is derived from the maximum rate of degradation per hour of silage acids, sugar, rapidly degradable starch (B1), and soluble fibre (B2).
Slow Pool Kd (%/hr)
The slow pool rate (Kd) is derived from the maximum rate of degradation per hour of the more slowly degraded B3 (NDF) fibre pool (hemicellulose, cellulose) and due to its heterogeneous nature, may also include slowly degraded starch.
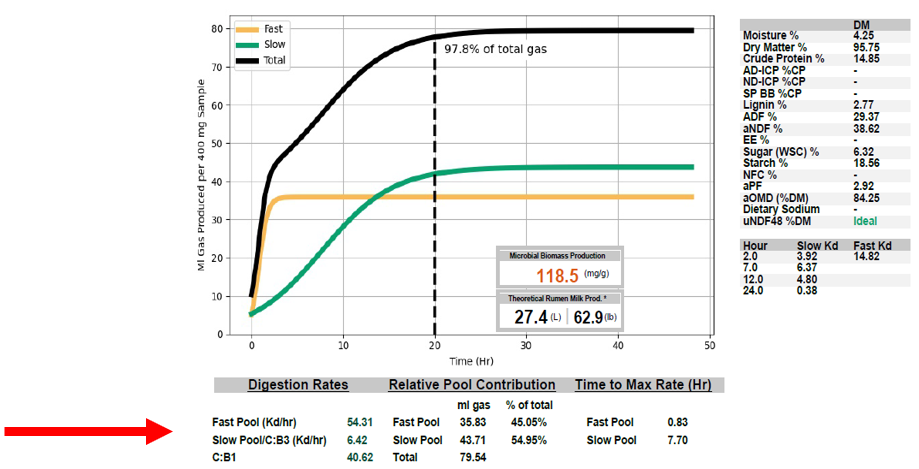
C:B1, C:B2 and C:B3 Kd (%/hr)
Carbohydrate pool-specific digestion rates (Kd) are the calculated maximum rates of degradation per hour for the B1, B2 and B3 carbohydrate pools. Note that these pools should not be considered as exclusive, due to the heterogeneous nature of nutrients which can exist in both the fast and slow pools. Also note that digestion rates are reported as normalized specific rates and not actual rates.
The table shows changes in digestion rate (Kd) over time, driven by changes in fermentation substrate (i.e. the creation of intermediate compounds). As an example, two ingredients could show the same digestion rate at 6 hours but one could remain at this rate for several hours whilst the other reduces immediately after 6 hours. The two ingredients are then biologically different, despite perhaps having the same name and similar digestion rate at a set time point. They should therefore be considered differently in ration modelling: the table can be used to identify the optimal time point digestion rate to use as the basis of a diet formulation.